4.2.0.0 Prediabetes
“Prediabetes” is the term used for individuals whose glucose levels do not meet the criteria for diabetes but are too high to be considered normal (23,24). Patients with prediabetes are defined by the presence of IFG and/or IGT and/or A1C 5.7–6.4% (39–47 mmol/mol) (Table 2.5). Prediabetes should not be viewed as a clinical entity in its own right but rather as an increased risk for diabetes and cardiovascular disease (CVD). Criteria for testing for diabetes or prediabetes in asymptomatic adults is outlined in Table 2.3. Prediabetes is associated with obesity (especially abdominal or visceral obesity), dyslipidemia with high triglycerides and/or low HDL cholesterol, and hypertension.
Diagnosis
IFG is defined as FPG levels between 100 and 125 mg/dL (between 5.6 and 6.9 mmol/L) (38,39) and IGT as 2-h PG during 75-g OGTT levels between 140 and 199 mg/dL (between 7.8 and 11.0 mmol/L) (40). It should be noted that the World Health Organization (WHO) and numerous other diabetes organizations define the IFG cutoff at 110 mg/dL (6.1 mmol/L).
As with the glucose measures, several prospective studies that used A1C to predict the progression to diabetes as defined by A1C criteria demonstrated a strong, continuous association between A1C and subsequent diabetes. In a systematic review of 44,203 individuals from 16 cohort studies with a follow-up interval averaging 5.6 years (range 2.8– 12 years), those with A1C between 5.5 and 6.0% (between 37 and 42 mmol/mol) had a substantially increased risk of diabetes (5-year incidence from 9 to 25%). Those with an A1C range of 6.0–6.5% (42–48 mmol/mol) had a 5-year risk of developing diabetes between 25 and 50% and a relative risk 20 times higher compared with A1C of 5.0% (31 mmol/mol) (41). In a community-based study of African American and non-Hispanic white adults without diabetes, baseline A1C was a stronger predictor of subsequent diabetes and cardiovascular events than fasting glucose (42). Other analyses suggest that A1C of 5.7% (39 mmol/mol) or higher is associated with a diabetes risk similar to that of the high-risk participants in the Diabetes Prevention Program (DPP) (43), and A1C at baseline was a strong predictor of the development of glucose-defined diabetes during the DPP and its follow-up (44).
Hence, it is reasonable to consider an A1C range of 5.7–6.4% (39–47 mmol/mol) as identifying individuals with prediabetes. Similar to those with IFG and/or IGT, individuals with A1C of 5.7– 6.4% (39–47 mmol/mol) should be informed of their increased risk for diabetes and CVD and counseled about effective strategies to lower their risks (see Section 3 “Prevention or Delay of Type 2 Diabetes”). Similar to glucose measurements, the continuum of risk is curvilinear, so as A1C rises, the diabetes risk rises disproportionately (41). Aggressive interventions and vigilant follow-up should be pursued for those considered at very high risk (e.g., those with A1C >6.0% [42 mmol/mol]).
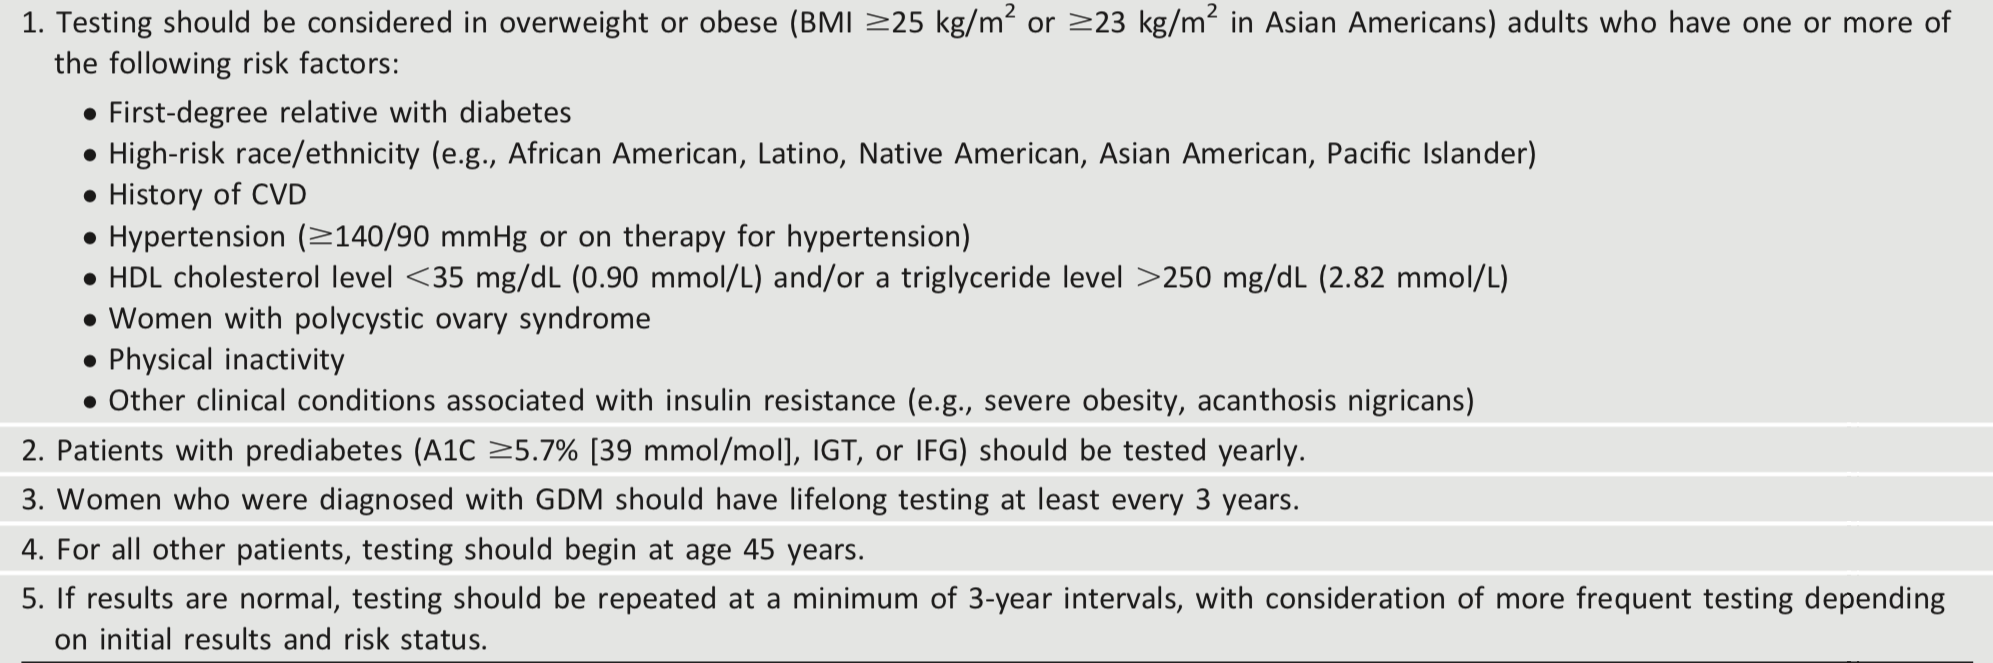
Table 2.5 summarizes the categories of prediabetes and Table 2.3 the criteria for prediabetes testing. The ADA diabetes risk test is an additional option for assessment to determine the appropriateness of testing for diabetes or prediabetes in asymptomatic adults. (Fig. 2.1) (diabetes.org/socrisktest). For additional background regarding risk factors and screening for prediabetes, see pp. S18–S20 (SCREENING AND TESTING FOR PREDIABETES AND TYPE 2 DIABETES IN ASYMPTOMATIC ADULTS and SCREENING AND TESTING FOR PREDIABETES AND TYPE 2 DIABETES IN CHILDREN AND ADOLESCENTS).
Table 2.3 - Criteria for testing for diabetes or prediabetes in asymptomatic adults
For interactive tool, See here
Table 2.4 - Risk-based screening for type 2 diabetes or prediabetes in asymptomatic children and adolescents in a clinical setting
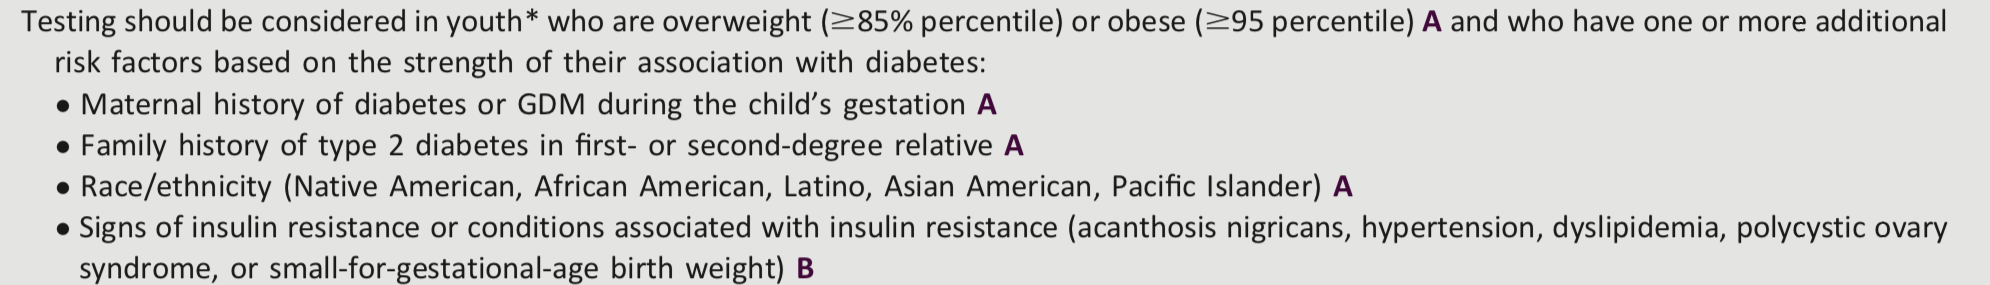
*After the onset of puberty or after 10 years of age, whichever occurs earlier. If tests are normal, repeat testing at a minimum of 3-year intervals, or more frequently if BMI is increasing, is recommended.
For interactive tool, See here
Table 2.5 - Criteria defining prediabetes*
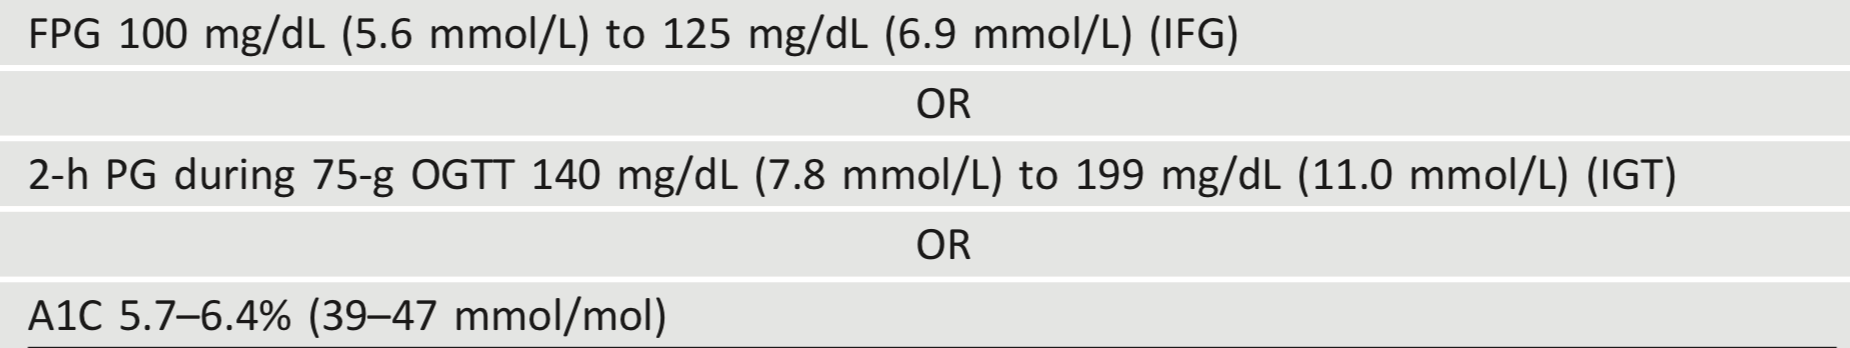
*For all three tests, risk is continuous, extending below the lower limit of the range and becoming disproportionately greater at the higher end of the range.