2.3.0.0 A1C and Mean Glucose
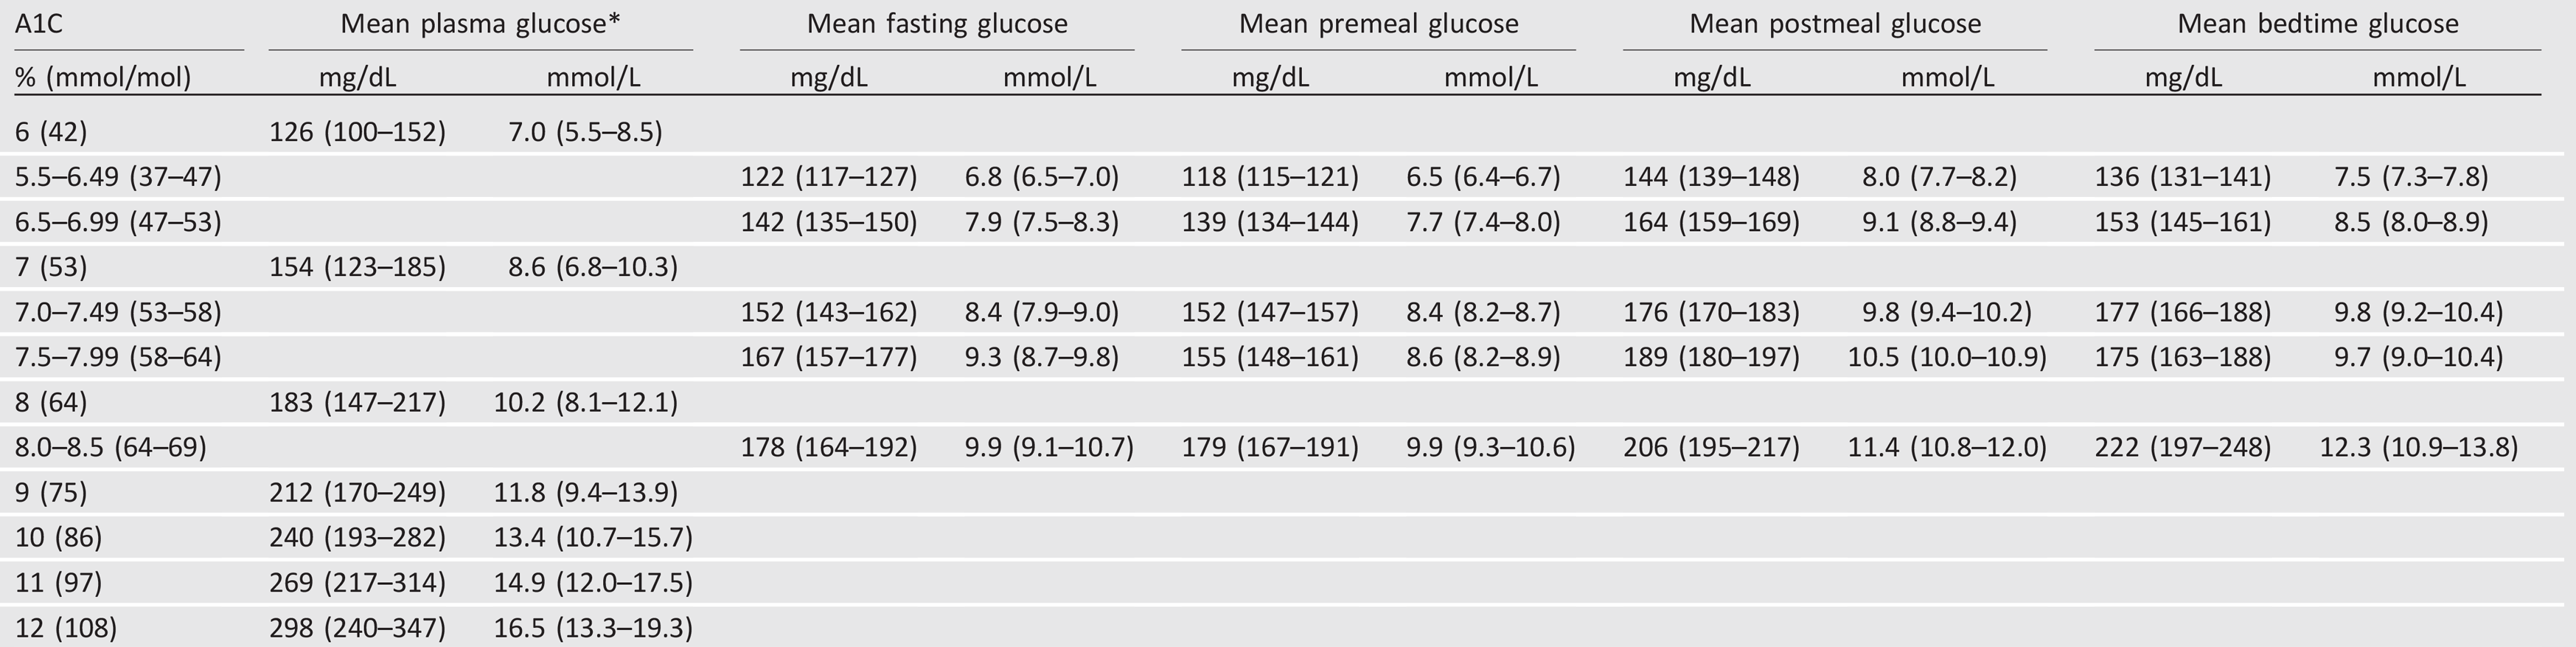
Table 6.1 shows the correlation between A1C levels and mean glucose levels based on two studies: the international A1C-Derived Average Glucose (ADAG) study, which assessed the correlation between A1C and frequent SMBG and CGM in 507 adults (83% non-Hispanic whites) with type 1, type 2, and no diabetes (6), and an empirical study of the average blood glucose levels at premeal, postmeal, and bedtime associated with specified A1C levels using data from the ADAG trial (7). The American Diabetes Association (ADA) and the American Association for Clinical Chemistry have determined that the correlation (r = 0.92) in the ADAG trial is strong enough to justify reporting both the A1C result and the estimated average glucose (eAG) result when a clinician orders the A1C test. Clinicians should note that the mean plasma glucose numbers in the table are based on ˜2,700 readings per A1C in the ADAG trial. In a recent report, mean glucose measured with CGM versus central laboratory–measured A1C in 387 participants in three randomized trials demonstrated that A1C may underestimate or overestimate mean glucose (5). Thus, as suggested, a patient’s CGM profile has considerable potential for optimizing his or her glycemic management (5).
Table 6.1—Mean glucose levels for specified A1C levels (6,7)
Data in parentheses represent 95% CI, unless otherwise noted. A calculator for converting A1C results into eAG, in either mg/dL or mmol/L, is available at http://professional.diabetes.org/eAG.
*These estimates are based on ADAG data of ;2,700 glucose measurements over 3 months per A1C measurement in 507 adults with type 1, type 2, and no diabetes. The correlation between A1C and average glucose was 0.92 (6).